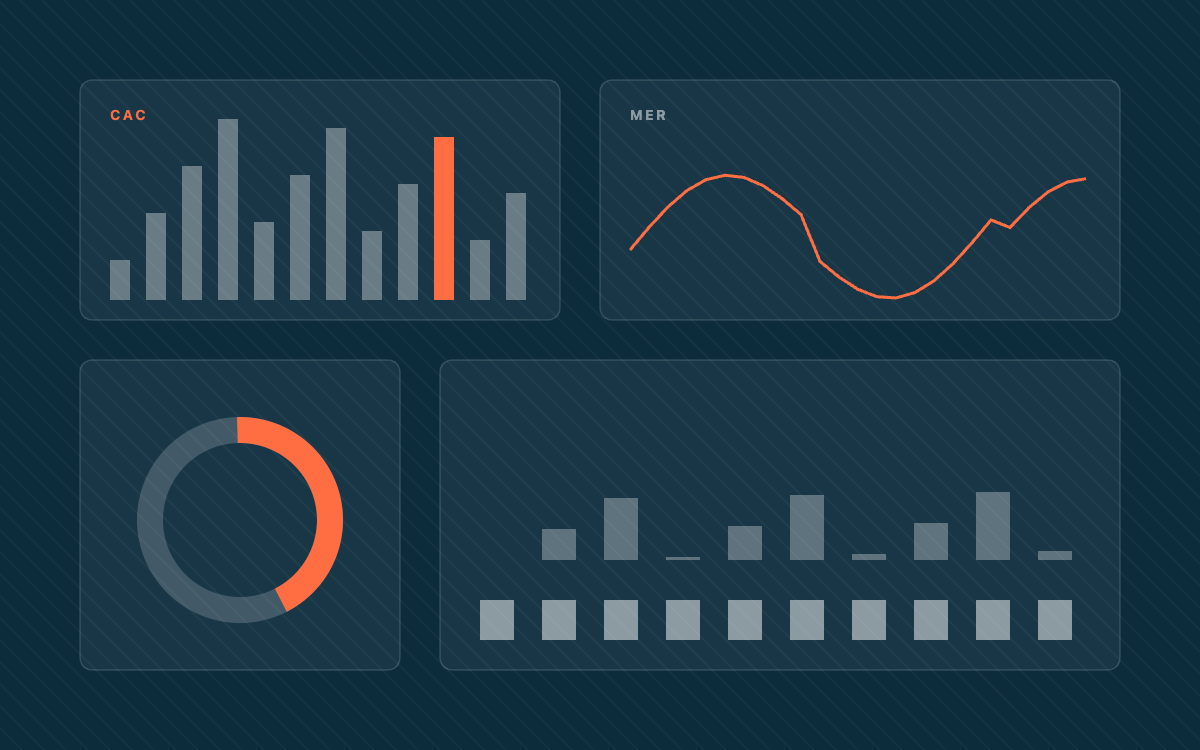
Consolidated five disconnected reporting spreadsheets into a single live BI dashboard covering the metrics that matter — CAC, LTV, ROAS, MER, contribution margin — with anomaly detection built in.
The Challenge
Marketing reporting lived in five separate spreadsheets maintained by different people, with inconsistent definitions, manual data entry, and no alerting when numbers moved unexpectedly.
Constraints
- Must consolidate data from multiple ad platforms, CRM, and finance systems
- Dashboard must be self-serve for non-technical stakeholders
- Reporting cadence must support both weekly reviews and ad-hoc deep dives
The Approach
Designed a unified data model with consistent metric definitions, built automated data pipelines from source systems, and created a live dashboard with anomaly detection that flags unexpected changes before they become problems.
Key Decisions
Standardize metric definitions before building the dashboard
Five spreadsheets meant five definitions of CAC. Aligning on definitions first prevented the dashboard from inheriting the same inconsistencies it was meant to fix.
- Build the dashboard first and reconcile definitions later
- Keep separate dashboards with a summary roll-up
Add anomaly detection to surface issues proactively
Stakeholders were discovering problems weeks late in manual reviews. Automated anomaly detection catches metric shifts in near-real-time.
Tech Stack
Result & Impact
- 40% reductionReporting time
Stakeholders moved from spreadsheet archaeology to a single source of truth with real-time visibility. Anomaly detection catches issues days earlier than manual review cycles.
Learnings
- Metric definition alignment is the real project — the dashboard is just the output
- Anomaly detection turns a reporting tool into an early warning system
Full case study in progress.